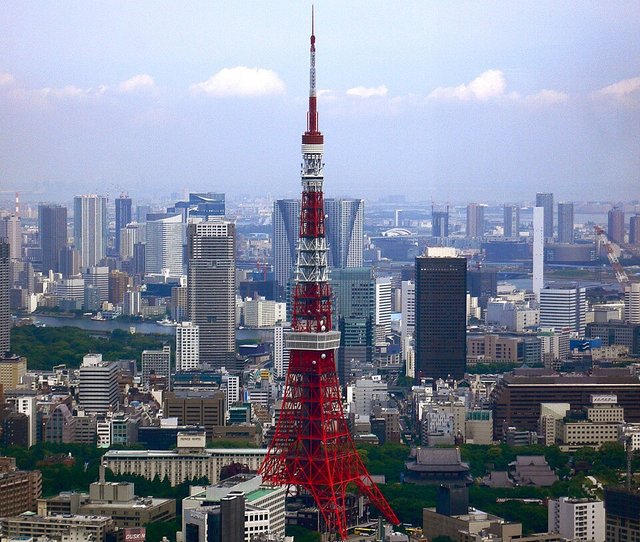
Neon alleyways, temple quiet and flawless transit overwhelm in the best way for first-timers who are hungry for layered urban detail.
Tokyo and Seoul are the two East Asian capitals most often weighed against each other by people moving for work. Numbeo’s 2026 Quality of Life Index has Tokyo at 175.4 and Seoul at 158.4. Seoul actually scores higher on purchasing power (133.3 against 121.7) and health care, and the two are level on safety. Tokyo’s lead comes from affordability and environment: its property price to income ratio is 15.2 against Seoul’s 27.2, its cost of living index is lower (54.2 against 68.2), its air is cleaner and its climate index is much higher. Commute times are long in both cities.
Head-to-head in 21 words
Tokyo leads Seoul by seventeen Numbeo points, mainly because housing costs far less relative to income and the air is cleaner.
On Numbeo’s 2026 Quality of Life Index, Tokyo reads 175.4 and Seoul 158.4, a gap of 17.0 points (76 against 69 on our 1–100 scale).
| Tokyo | Seoul | |
|---|---|---|
| 21words score (1–100) | 76 | 69 |
| Numbeo Quality of Life Index (2026) | 175.4 | 158.4 |
| Region | Asia | Asia |
| Numbeo Purchasing Power Index (higher is better) | 121.7 | 133.3 |
| Numbeo Safety Index (higher is better) | 74.9 | 75.3 |
| Numbeo Health Care Index (higher is better) | 78.7 | 82.9 |
| Numbeo Cost of Living Index (lower is cheaper) | 54.2 | 68.2 |
| Numbeo Property Price to Income Ratio (lower is better) | 15.2 | 27.2 |
| Numbeo Traffic Commute Time Index (lower is better) | 42.7 | 41.2 |
| Numbeo Pollution Index (lower is better) | 43 | 50.9 |
| Numbeo Climate Index (higher is better) | 85.3 | 68.4 |
| Rank in our Cities Top 21 | 15th of 21 | joint 17th of 21 |
| Last checked | 2 November 2026 | 2 November 2026 |
Neon alleyways, temple quiet and flawless transit overwhelm in the best way for first-timers who are hungry for layered urban detail.
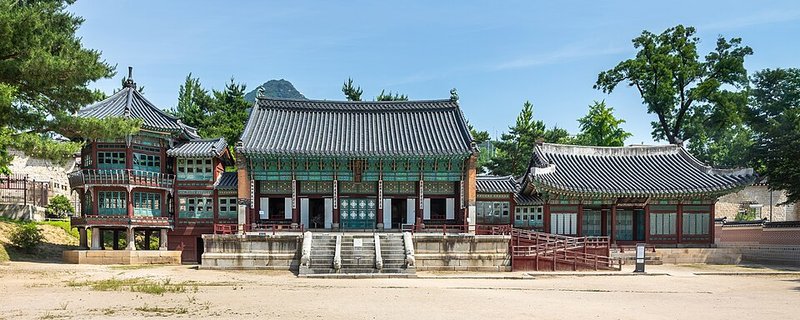
Quiet palace mornings, mountain trails and nightlife districts keep energy high for travelers chasing food, technology, fashion and late-night subway rides.
Numbeo’s index is crowd-sourced: residents and visitors submit survey answers, so readings can move between updates and small gaps (under about five points) are within normal noise. It measures everyday living conditions, not sights, culture, job markets, visas or taxes.
Numbeo component figures: Numbeo Quality of Life Index by City 2026, retrieved 2 November 2026. Numbeo data is crowd-sourced survey data.
Source notes as recorded on our Cities list: Tokyo: Numbeo QoL 175.4 (Asia) → round(175.4/2.3)=76 — https://www.numbeo.com/quality-of-life/rankings.jsp?title=2026. Seoul: Numbeo QoL 158.4 (Asia) → round(158.4/2.3)=69 — https://www.numbeo.com/quality-of-life/rankings.jsp?title=2026.
On Numbeo’s 2026 Quality of Life Index, Tokyo reads 175.4 and Seoul 158.4, a gap of 17.0 points (76 against 69 on our 1–100 scale). In our Cities Top 21, Tokyo is 15th of 21 and Seoul joint 17th of 21.
Each 21words city score is the city’s Numbeo Quality of Life Index divided by 2.3 and capped at 100, so an index reading of about 230 maps to 100. Both were last checked on 2 November 2026, and we re-check every Monday.