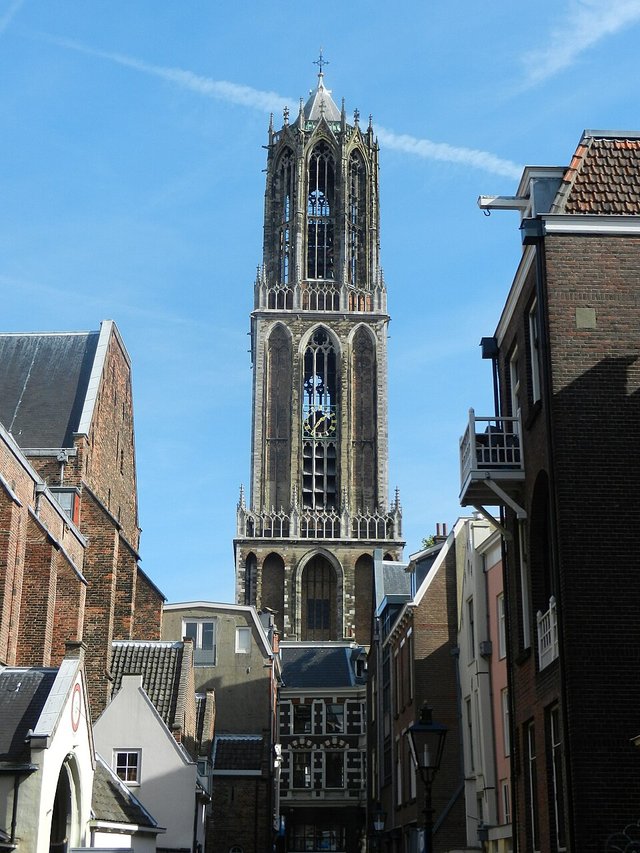
This canal-lined student city packs medieval towers, cafes and compact walkability, feeling like Amsterdam without the crushing crowds of day tourists.
Utrecht and Eindhoven are two of the three Dutch cities at the top of our cities list, and Numbeo’s 2026 Quality of Life Index separates them by just over two points: Utrecht 221.6, Eindhoven 219.4. Utrecht has higher purchasing power and a clearly higher health care index (85.6 against 80.2). Eindhoven is cheaper day to day (cost of living index 71.7 against 77.3) and has cleaner air. Safety, housing affordability and commute times are almost identical. In practice the choice is about work and setting: Eindhoven’s tech and design economy against Utrecht’s central rail hub and historic centre.
Head-to-head in 21 words
Utrecht edges Eindhoven by two Numbeo points, a statistical tie; Eindhoven is cheaper and cleaner, Utrecht is stronger on health care.
On Numbeo’s 2026 Quality of Life Index, Utrecht reads 221.6 and Eindhoven 219.4, a gap of 2.2 points (96 against 95 on our 1–100 scale).
| Utrecht | Eindhoven | |
|---|---|---|
| 21words score (1–100) | 96 | 95 |
| Numbeo Quality of Life Index (2026) | 221.6 | 219.4 |
| Region | Europe | Europe |
| Numbeo Purchasing Power Index (higher is better) | 149.1 | 144.6 |
| Numbeo Safety Index (higher is better) | 79 | 79.1 |
| Numbeo Health Care Index (higher is better) | 85.6 | 80.2 |
| Numbeo Cost of Living Index (lower is cheaper) | 77.3 | 71.7 |
| Numbeo Property Price to Income Ratio (lower is better) | 7.1 | 7 |
| Numbeo Traffic Commute Time Index (lower is better) | 21.7 | 22.6 |
| Numbeo Pollution Index (lower is better) | 22.7 | 19.6 |
| Numbeo Climate Index (higher is better) | 87.2 | 85.4 |
| Numbeo rent, 1-bedroom flat in the centre (per month) | €1,768 | €1,568 |
| Numbeo rent, 1-bedroom flat outside the centre (per month) | €1,368 | €1,263 |
| Numbeo monthly costs, single person, excluding rent | €1,058 | €986 |
| Rank in our Cities Top 21 | 2nd of 21 | 3rd of 21 |
| Last checked | 2 November 2026 | 2 November 2026 |
This canal-lined student city packs medieval towers, cafes and compact walkability, feeling like Amsterdam without the crushing crowds of day tourists.
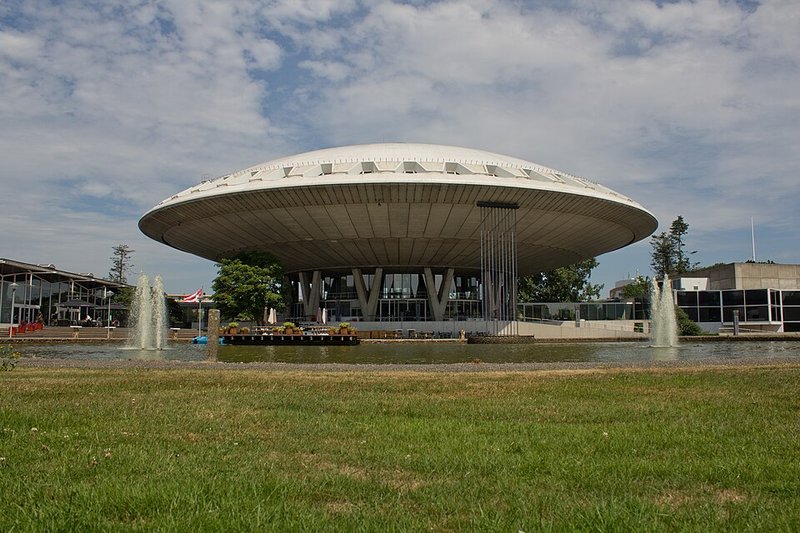
Design Week, tech campuses and warm Dutch streets reward makers who want culture without big capital-city crowds or overwhelming skyline spectacle.
Numbeo’s index is crowd-sourced: residents and visitors submit survey answers, so readings can move between updates and small gaps (under about five points) are within normal noise. It measures everyday living conditions, not sights, culture, job markets, visas or taxes.
Numbeo component figures: Numbeo Quality of Life Index by City 2026, retrieved 2 November 2026. Rent and monthly cost figures: Numbeo cost of living pages for Utrecht and Eindhoven (Numbeo update of 1 November 2026), retrieved 2 November 2026. Numbeo data is crowd-sourced survey data.
Source notes as recorded on our Cities list: Utrecht: Numbeo QoL 221.6 (EU) → round(221.6/2.3)=96 — https://www.numbeo.com/quality-of-life/rankings.jsp?title=2026. Eindhoven: Numbeo QoL 219.4 (EU) → round(219.4/2.3)=95 — https://www.numbeo.com/quality-of-life/rankings.jsp?title=2026.
On Numbeo’s 2026 Quality of Life Index, Utrecht reads 221.6 and Eindhoven 219.4, a gap of 2.2 points (96 against 95 on our 1–100 scale). In our Cities Top 21, Utrecht is 2nd of 21 and Eindhoven 3rd of 21.
Each 21words city score is the city’s Numbeo Quality of Life Index divided by 2.3 and capped at 100, so an index reading of about 230 maps to 100. Both were last checked on 2 November 2026, and we re-check every Monday.