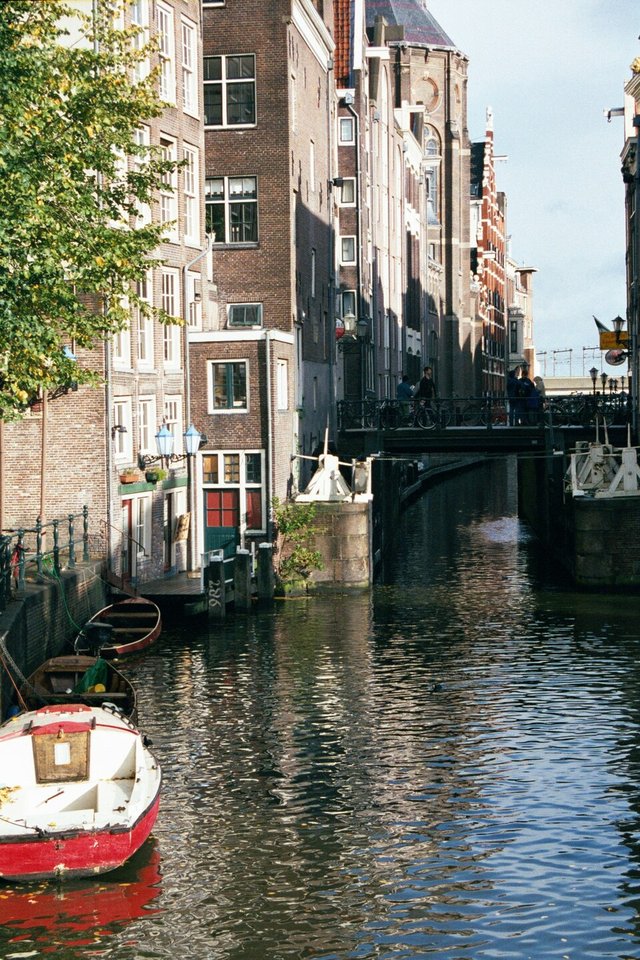
Flat bike culture, strong healthcare and tidy cities make short trips feel effortless, from quiet canals out to North Sea beaches.
Head-to-head · Countries Top 21
The Netherlands and Belgium share a border, a language in Flanders and a lot of history, but Numbeo’s 2026 Quality of Life Index separates them by 38 points: the Netherlands reads 213.6 and Belgium 175.2. The Dutch lead comes mainly from safety (74.5 against 50.8), pollution (20.9 against 46.8, lower is better) and commute times. Belgium is cheaper: its cost of living index is 68.6 against 73.4, its property price-to-income ratio 6.1 against 7.5, and a central one-bedroom flat averages €888 a month against €1,511 on Numbeo. Belgium is not one of the 21 countries on our list; its 76 here uses the same Numbeo formula, for this comparison only.
Head-to-head in 21 words
The Netherlands beats Belgium on Numbeo through safety, cleaner air and shorter commutes, while Belgium wins on cheaper rent and housing.
On Numbeo’s 2026 Quality of Life Index, Netherlands reads 213.6 and Belgium 175.2, a gap of 38.4 points (93 against 76 on our 1–100 scale).
| Netherlands | Belgium | |
|---|---|---|
| 21words score (1–100) | 93 | 76 |
| Numbeo Quality of Life Index (2026) | 213.6 | 175.2 |
| Region | Europe | Europe |
| Numbeo Purchasing Power Index (higher is better) | 136.6 | 127.5 |
| Numbeo Safety Index (higher is better) | 74.5 | 50.8 |
| Numbeo Health Care Index (higher is better) | 81.5 | 76.4 |
| Numbeo Cost of Living Index (lower is cheaper) | 73.4 | 68.6 |
| Numbeo Property Price to Income Ratio (lower is better) | 7.5 | 6.1 |
| Numbeo Traffic Commute Time Index (lower is better) | 22.3 | 32.7 |
| Numbeo Pollution Index (lower is better) | 20.9 | 46.8 |
| Numbeo Climate Index (higher is better) | 86.9 | 86.5 |
| Numbeo rent, 1-bedroom flat in the centre (per month) | €1,511 | €888 |
| Numbeo rent, 1-bedroom flat outside the centre (per month) | €1,202 | €780 |
| Numbeo monthly costs, single person, excluding rent | €1,019 | €973 |
| Rank in our Countries Top 21 | 1st of 21 | not on our list (same formula: 76) |
| Last checked | 2 November 2026 | 2 November 2026 |
Flat bike culture, strong healthcare and tidy cities make short trips feel effortless, from quiet canals out to North Sea beaches.
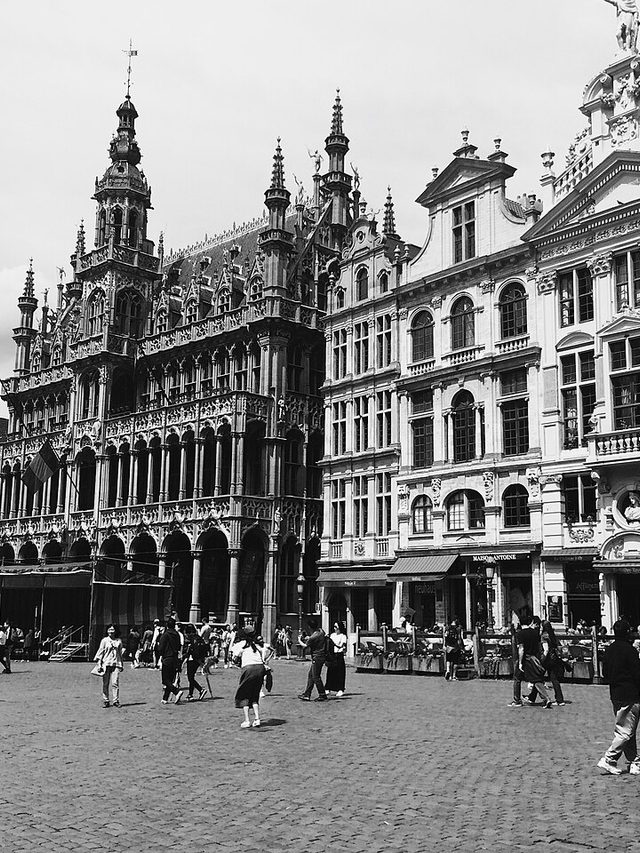
Belgium packs EU institutions, Flemish art cities and Ardennes forests into a country where housing costs less than in the Netherlands.
A national Quality of Life reading averages very different regions, and Numbeo’s survey-based data can move between updates; gaps of a few points are not meaningful. It does not capture visas, taxes, language or job markets, which usually decide a move.
Numbeo component figures: Numbeo Quality of Life Index by Country 2026, retrieved 2 November 2026. Rent and monthly cost figures: Numbeo cost of living pages for Netherlands and Belgium (Numbeo update of 1 November 2026), retrieved 2 November 2026. Numbeo data is crowd-sourced survey data.
Source notes: Netherlands: Numbeo country QoL 213.6 (EU) → round(213.6/2.3)=93 — https://www.numbeo.com/quality-of-life/rankings_by_country.jsp?title=2026. Belgium: Numbeo country QoL 175.2 (EU) → round(175.2/2.3)=76 — https://www.numbeo.com/quality-of-life/rankings_by_country.jsp?title=2026. Belgium is not on our Countries Top 21; its score is calculated with the same formula for this comparison only.
On Numbeo’s 2026 Quality of Life Index, Netherlands reads 213.6 and Belgium 175.2, a gap of 38.4 points (93 against 76 on our 1–100 scale). In our Countries Top 21, Netherlands is 1st of 21 and Belgium not on our list (same formula: 76).
Each 21words country score is Numbeo’s country-level Quality of Life Index divided by 2.3 and capped at 100. Both were last checked on 2 November 2026, and we re-check every Monday.